Documentation

What does LION do?

LION helps Cancer researchers form hypotheses by giving them a graph based view of the research literature.


How is LION's graph made?

We mine Cancer abstracts from Pubmed, extract relevant biological entities from each one. Each biological entity is a node in our graph and edges between entities represent (roughly) how many abstracts the two entities appear together in.


Getting started

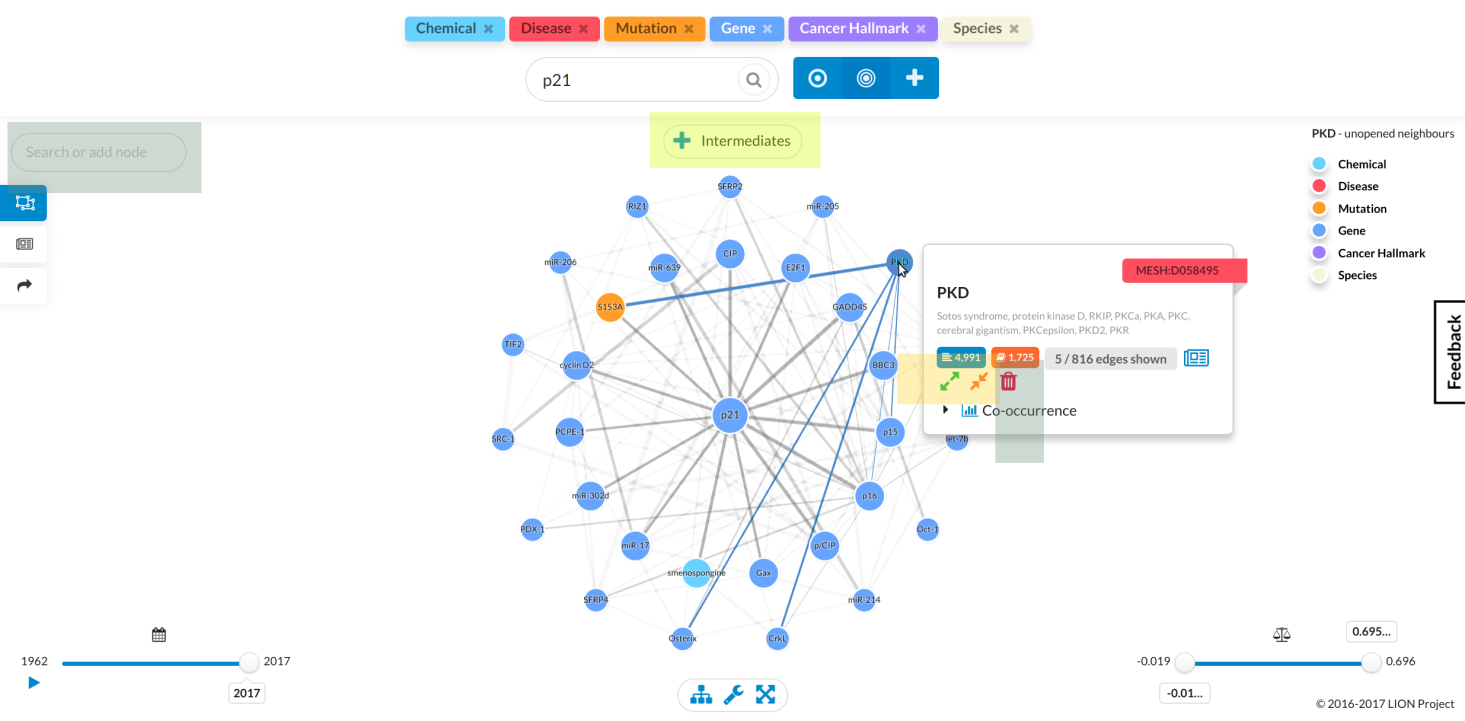
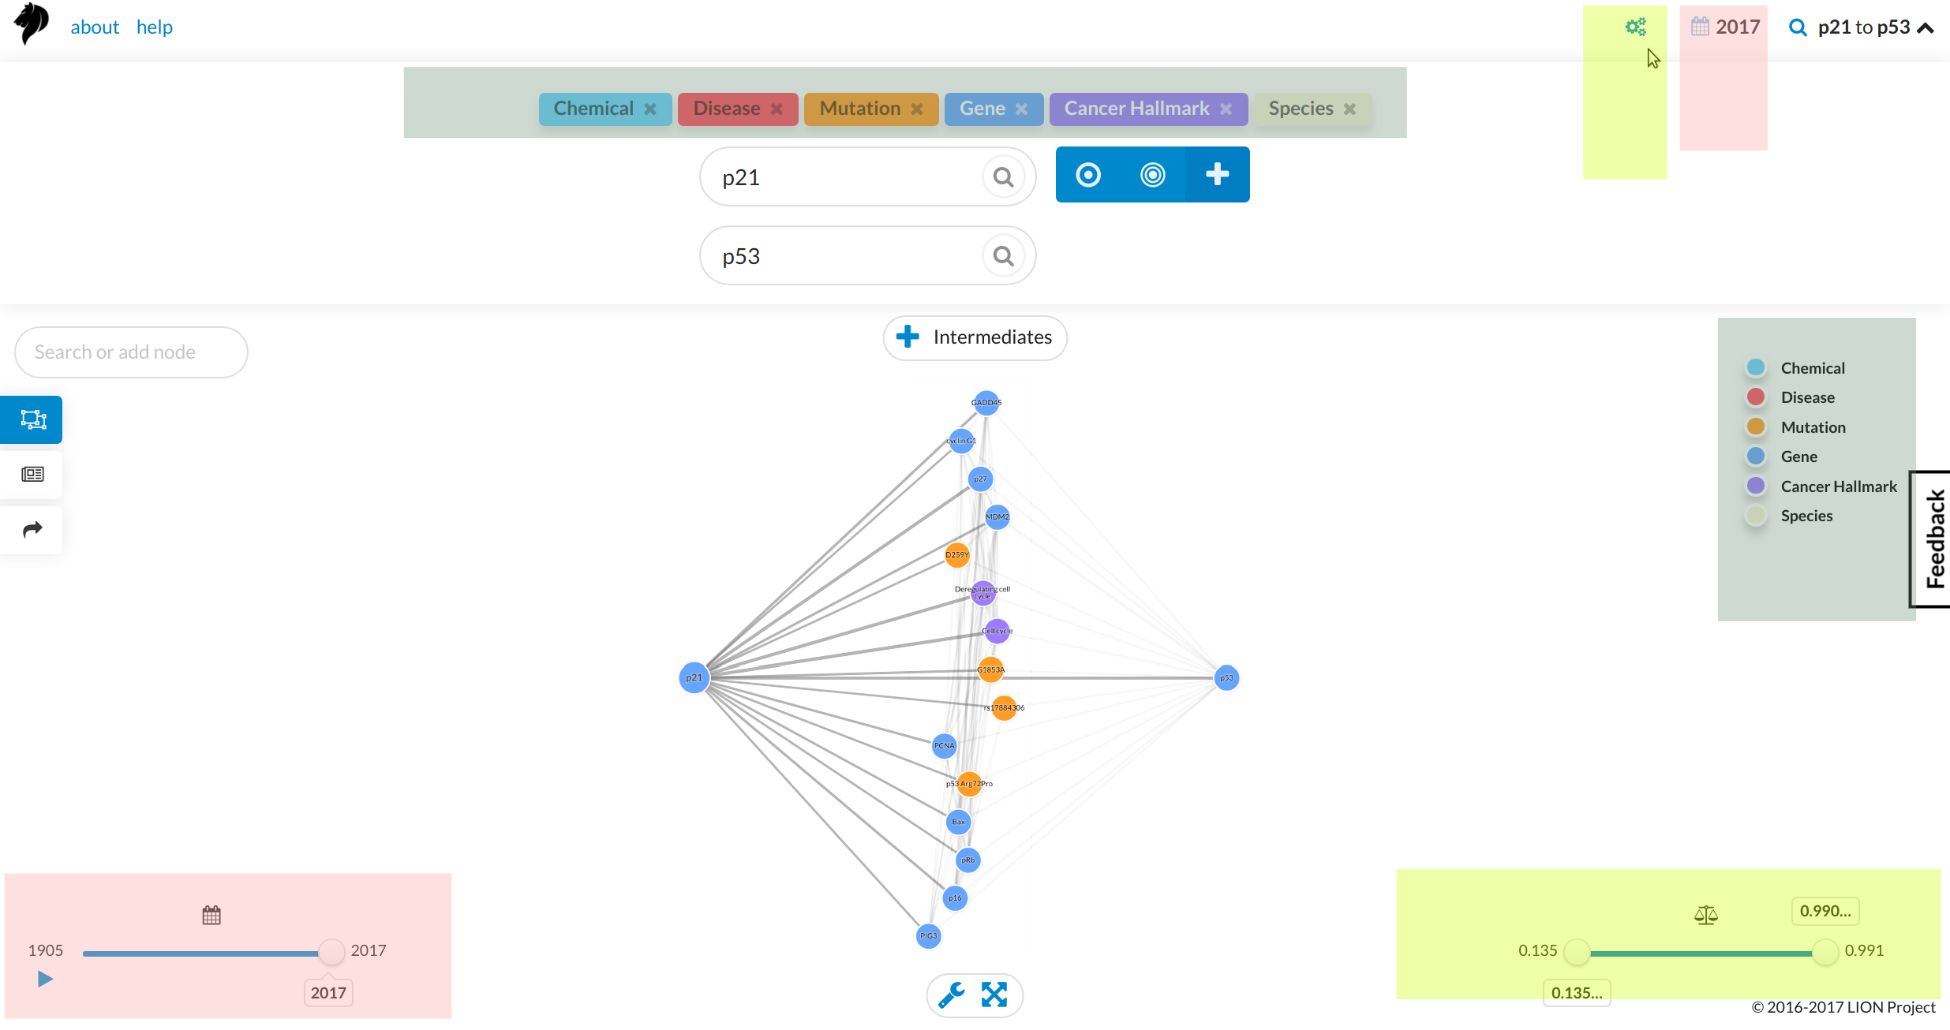
To start with you enter a search query. Depending on the query type, you get one of three results

  • Neighbours search - finds other biological terms directly connected to the search term.
  • Open search - finds biological terms that share neighbours with the search term (i.e. two steps away from the search term).
  • Closed search - for this you enter a destination term, and the search returns terms that connect the query term to the destination term.
These are shown next to the query box, from left to right.


Working with the graph

Viewing

  • Node info - Rolling over a graph node will bring up information about the node. Along with the node's canonical identifier (on the top right), the dialog shows the number of mentions of the node, and in how many abstract the node was mentioned, and how many edges connect to the node.
  • Edge info - Clicking on a graph edge, brings up data about the number of times the connected nodes co-occur, and in how many documents, when the nodes were first co-mentioned and the value of the connectedness metric. The abstracts in which the connected nodes co-occur are also listed.
  • Text mode - This is an alternative to the graph view, in which the query node is shown at the top, and all connected nodes are listed underneath. You can access text mode from the graph by clicking the newspaper icon on the left hand menu.
  • Alternative graph layouts - The menu at the bottom of the graph allows you to change the graph type to get a more parsimonious layout for your query. For example, the concentric circles layout might help you when performing an open discovery query.
  • Saving as an image - To do this click the spanner icon at the bottom of the graph and select either PNG or JPG. It's that easy!


Navigating

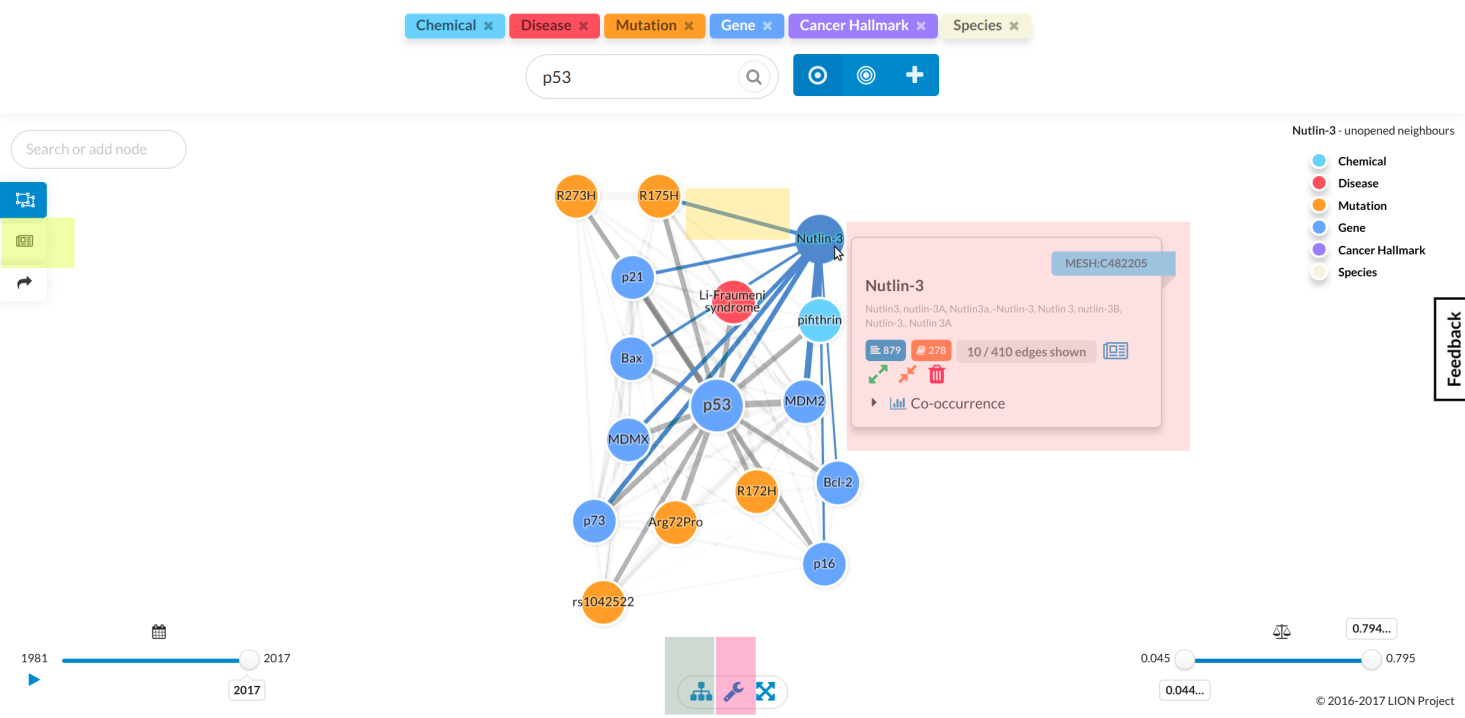
Once you've entered a query and LION returns a graph, you can start exploring it, with the following operations to help you:

  • Expand/Collapse node - clicking on a node, brings up the node info, from which you can expand (outward arrows icon) or collapse it (inwards arrows icon). Expanding a node fetches that node's direct neighbours and adds them to the graph. Collapsing a node undoes the expansion.
  • Add/delete node - if you're interested in how a biological entity that's not on the graph is related, you can add it as a node via the 'Search or add node' bar at the top left of the graph.
  • Add intermediates - for open discovery or closed discovery search modes, you can fetch more intermediate nodes (B nodes, in A-B-C, where A is the search term) by clicking '+ Intermediates' at the top-middle of the graph.


Filtering

  • Filter abstracts by year - toggle the filter at the bottom left of the graph. To filter on the server side, set the year on the top right of the page.
  • Filter edges by weight - toggle the filter at the bottom right of the graph. To filter what the LION server returns, you can set the edge weight filters with the settings on the top right of the page.
  • Filter nodes by biological entity type - toggle the entity types on the right of the graph. Or to choose the entities the server returns set the at the top of the page.


Contact us

If you require further help, contact us on ltllionproject@gmail.com